
Here's an article he sent that puts in perspective the changing costs of natural gas. Given our goal of using domestically produced gas as our primary, and cleanest, large-scale energy source, as we wait for renewables to grow, we should be aware of the unpredictability of that energy source, what impacts pricing, and the risks involved.
Here's part of the story: You can find the rest at: http://www.rbnenergy.com/the-mighty-algonquin-supplying-new-england-the-eskimos
The Mighty Algonquin – Supplying (New England Natural Gas) to The Eskimos
Natural gas prices at New England City Gates spiked up $6/MMBtu during a recent cold spell in November only to fall back $4/MMBtu last Friday (November 30, 2012) on forecasts of warmer weather. There have been three periods of price volatility in New England during the past year. The close proximity of 7 Bcf/d of shale gas production from the Marcellus is not helping. Today we look at the New England natural gas supply situation.
During November 2012, natural gas prices for day-ahead deliveries from the Algonquin Gas Transmission (AGT) pipeline into local distribution company (LDC) city gates in New England went on a rollercoaster ride. The spread between AGT City Gate prices and the NYMEX Henry Hub natural gas futures prompt month fluctuated from a low of $0.70/MMBtu on November 1, 2012 to a high of $8.30 on November 27 and back down to close the month at $2.50 /MMBtu last Friday (see the blue line, left axis, on the chart below).
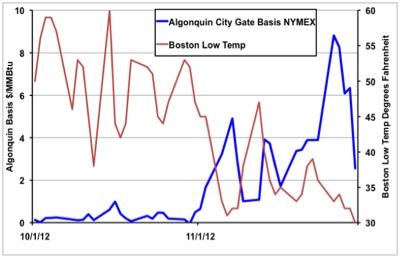 The red line on the chart (right axis) shows daily low temperatures for the largest city in the region – Boston. The data indicates that natural gas prices spiked when Boston low temperatures dropped into the 30’s Fahrenheit. Price spikes like these are not new phenomena for Algonquin city gate this year and they are not just associated with low winter temperatures. The chart below shows the same Algonquin/NYMEX basis relationship since December 2011. There were three periods (red circles) when prices spiked up sharply. Those three periods were the “non-winter” of 2011-2012 (so called because temperatures were uncharacteristically mild last winter), the summer of 2012 and the November spike we saw in the first chart. What is causing these price fluctuations in New England...?
 | Make sense out of the interrelationships between crude oil, natural gas and NGLS. RBN School of Energy brings the RBN Energy brand of energy market fundamentals to an intensive two-day course of study to be held Feb.12-13, 2013, at the St. Regis in Houston, TX. For more information, see http://www.rbnenergy.com/save-the-date |
No comments:
Post a Comment