We discussed this on a recent radio show. Knowledge is power. We applaud NASA for giving us the tools to track carbon and get better data on its intensity, shifting patterns and potential global influence on weather.
Satellites are one of our greatest scientific tools. They are now also one of our greatest economic tools as we monitor environmental changes and revamp our lives to live resiliently within those changes.
NASA Satellites Start Tracking Down the Sources of Climate Change
by Alan Boyle
NASA scientists are showing off some of the first results from a fresh crop of satellites and space station sensors designed to track the factors behind climate change and extreme weather on a near-real-time basis.
Some of the observing instruments are still being calibrated, but they're already providing data for weather forecasts and climate modeling, the scientists said. The latest Earth-monitoring missions include:
- The Global Precipitation Measurement Core Observatory, or GPM, which was launched a year ago to provide the equivalent of a global CT scan for the clouds that produce rain and snow. NASA's mission cost is $933 million.
- The Orbiting Carbon Observatory-2, or OCO-2, which went into orbit last July to track the sources of carbon dioxide being added to the atmosphere, as well as the channels by which carbon is removed from the air. Mission cost is $468 million.
- ISS-RapidScat, a scatterometer that measures wind speeds and direction over the ocean from a vantage point on the International Space Station. The $26 million instrument was delivered to the station in September during a SpaceX Dragon resupply flight.
- The Cloud-Aerosol Transport System, a laser ranging device that measures the altitude of clouds and airborne particles. CATS is a $15 million technology demonstration mission that was flown up to the space station on a Dragon in January.
- The Soil Moisture Active Passive observatory, or SMAP, which was launched in January on a $916 million mission to measure moisture levels in Earth's topsoil.
"The radar, from Japan, takes three-dimensional imagery of precipitation, almost like a CT scan, like your doctor would do," Skofronick-Jackson explained. "The passive instrument, from NASA, provides intensities of precipitation, in an image like an X-ray. These show the internal characteristics of clouds and precipitation."
The readings from GPM and RapidScat are being factored into storm forecasts, including the outlook for hurricanes and other types of tropical cyclones. "RapidScat is being used even as we speak," said Brian Stiles, the mission's science processing lead at NASA's Jet Propulsion Laboratory.
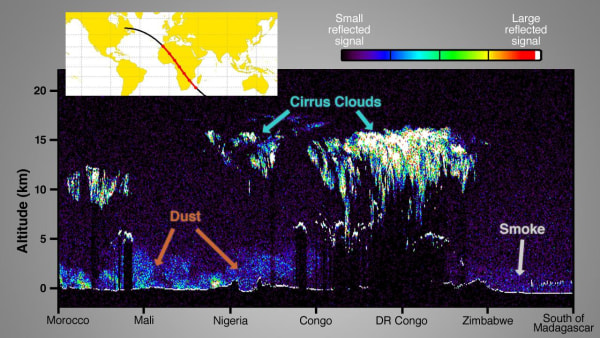
The scientists behind the CATS mission released their first public image, showing clouds and particulates in a cross-section of the atmosphere over Africa on Feb. 11. In the northern part of the continent, the dominant signature was dust from the Sahara Desert. Over central Africa, the space station instrument registered cirrus clouds rising to a height of 10 miles (16 kilometers) or so. CATS also tracked the smoke rising from fires in Zimbabwe in southern Africa.
"We're continuing to see good-quality data," said CATS principal investigator Matt McGill, who is based at Goddard Space Flight Center.
OCO-2 is focusing on a key factor behind potential climate shifts: the patterns behind emission of carbon dioxide into the atmosphere, and its removal from the atmosphere. CO2 is produced through natural processes as well as industrial processes, and it's typically removed through photosynthesis and other natural "sinks." Eventually, OCO-2 should be able to map the planet's carbon cycle in unprecedented detail.
Ralph Basilio, OCO-2's project manager at JPL, said the ultimate goal is to "improve understanding of the global climate change process and make better-informed decisions."
The first map from the mission shows relatively high concentrations of carbon dioxide in northern latitudes and along a band of central Africa, during a time frame running from Nov. 21 to Dec. 27. Basilio said the findings were consistent with the expectation that northern concentrations would be higher during winter, when plants are dormant and more fossil fuels are being burned for heating.
However, he cautioned that the readings still had to be adjusted to account for clouds, haze and dust. Over the long term, OCO-2's observations will give scientists a better handle on where the planet's CO2 is coming from — and just as importantly, where it's being removed from the atmosphere.
"We want to be able to analyze what happens to these sinks from season to season, from year to year, because we know there will be changes," Basilio told NBC News. "What's going to happen to these sinks over time? Will these sinks become saturated? Will that mean that more CO2 remains in the atmosphere, and will that mean that CO2 is going to have a greater effect on the global climate change process? These are some of the very fundamental questions that we want to be able to answer."


No comments:
Post a Comment